|
A good financial model is a little bit like magic. You can gaze into the future and compare how decisions you make today affect what happens for years to come. Of course, even the best financial model is only a representative of what could happen. None of us can truly see into the future, try as we might. What makes a “good” financial model? A financial model is just a business tool, so a good one is one that gets the job done. It should be error-free, clear to use and provide results that are easy to interpret. Similarly, you need a different tool for different jobs; the financial modelling requirements of a listed company are going to outweigh those of a young startup.
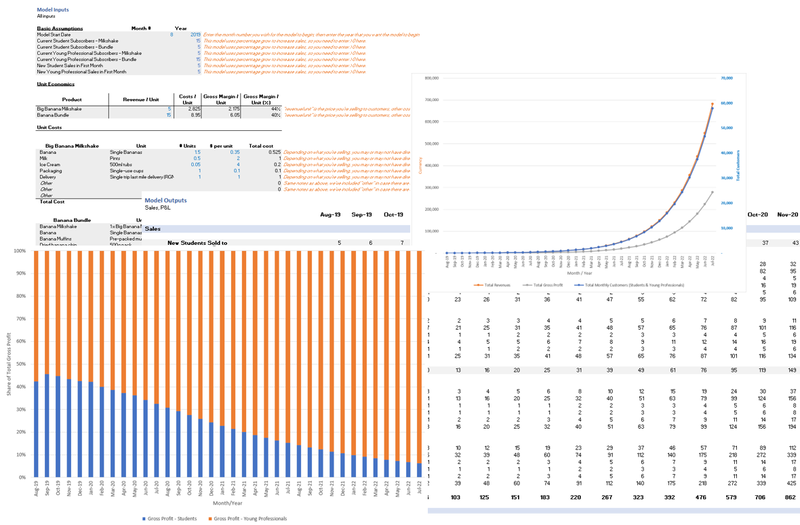
When we planned this post, we were intending to share a financial model template that we’d found online and provide some usage notes / pro tips. However, it turns out that there is a dearth of appropriate models that are ready to use by reasonably inexperienced people. The models we came across were either overcomplicated or very limited, so we decided to create our own! You can download our subscription model template at the bottom of this post, and below you’ll find some good modelling principles to help you make your own. Garbage in, garbage out The first rule when creating projections of any sort is: garbage in, garbage out (GIGO). This simply means that if you make wild or erroneous (or both) assumptions when putting information in, you can only expect to get wild or erroneous results out. If my model says I can take 10% of the total addressable market, but I get the market size wrong, my model will be wrong. This means that the initial research behind your figures is crucial. Research your inputs and check your assumptions as much as possible before entering them into any financial model. You can be sure that investors will ask, “how did you get to this number?”, so be ready to defend your projections. Top down vs bottom up Check out our recent post on top-down vs bottom-up approaches to market sizing. With financial modelling, we also want to start at the bottom and work back. For instance, if you simply estimate your sales are growing at 10% month on month, you can quickly miss the underlying details. Your sales are unlikely to grow for no reason. More likely, you have marketing and sales expenses that together help drive sales. At the very least, you need to consider in detail how your HR, marketing and related costs are going to contribute to increased sales. Rather than assume sales grow at 10% and sales staff expense grows at +1 person a year, ask how many sales one salesperson can make in a month then multiply this out to the year, then work up to sales output. KISS Keep it simple, stupid (KISS) is a design principle that is clear to understand: keep things as simple as possible, so that they’re easier to use. This goes for financial models too: separate your inputs clearly, build your model logically and add notes wherever necessary. Adding usage notes is not only good practice for any spreadsheet design, but it'll help you understand what you've done so far, in case you start to get stuck with your model. If you make a good pitch to an investor, there's every chance they're going to want to see your financial model - so it's good for it to be clean and easy to read. Use charts effectively Don’t rely on people to read hundreds of lines of your model. If your model requires complex calculations that’s fine, but these rows shouldn’t be used to present information. In our template, there are “inputs” and “outputs” plus some charts. This is to keep things straightforward (and our outputs are only 100 lines or so). Another approach is to model sales and revenues separately to costs and then to present the outputs of these sheets in a summary sheet. Whichever you do, it’s advisable to add some charts to show what’s going on in the model. If you haven’t seen it yet, check out our quick guide on what makes a good chart. Build what you need, then stop Think about building your financial model like building a ladder. You need enough information (rungs) for your purpose. You might even add a few extra rungs, to make it easier to get on and off the ladder at the top. But if you keep adding rungs, you’re going to have a very large ladder that’s cumbersome to move around and doesn’t offer much beyond the much smaller one that suits your need. Financial models can go on and on, but there comes a point where adding more variables isn’t necessarily making your model any more accurate. If the model represents key costs, how you acquire customers and how you generate income and adapts to show different outputs based on your input assumptions, it’s probably all you need to begin with. Remember, the more complex something is, the easier it is for errors to hide. It’s better to have a simple and correct model than a complex and wrong one. You can download our basic subscription financial model here. Our intention isn’t to provide a one-size-fits-all model (does such a thing exist?) but rather to guide founders on how to go about representing their business model in spreadsheets. The best financial model in the world won’t grow your business, but clearly laying out how your business makes money should help you make better decisions. Good luck! Comments are closed.
|
Categories
All
Archives
September 2020
|


 RSS Feed
