|
Covid-19 has changed how people think about investing, at least for now. Funds were quick to offer advice that more or less said: spend less money while making the same money or more money. Which raises the question, what were companies doing beforehand? Of course the first response is that growth costs money and startups should be growing exponentially. But there’s a wider observation here which the market is closer to accepting: supporting growth at any cost and really nasty unit economics, probably isn’t always the smartest investment you can make.
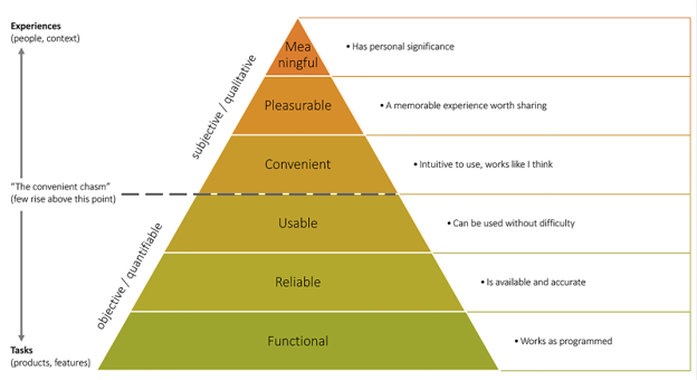
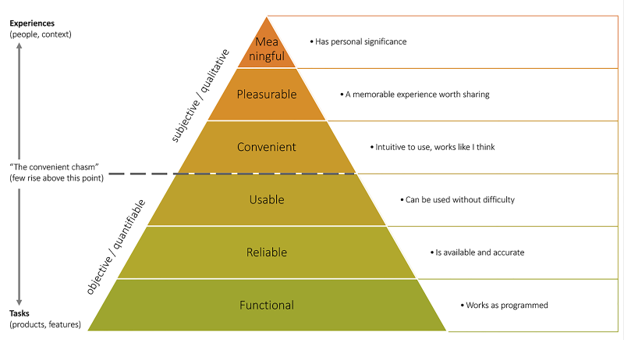
What happens next? This is the question on everyone’s mind. Do we see a L-U-V? For the uninitiated, these letters indicate the possible shapes of economic recession and recovery and - spoiler alert - no one knows which it’ll be. “V” sees the economy bouncing back, “U” a slower recovery and “L” a very long / slow one. The most common sense analysis that your writer has come across suggests that the recovery will be sector-specific; regardless of the overall shape, the shape for different sectors will differ. As investors, that means finding the sectors that are going to look more like “V” than “L”. Right about now readers of this post are probably thinking of delivery businesses as hot new sectors, but we’d caution that such business has seen an increase in demand (not a decrease as many sectors) and this demand may lull as restaurants and shops open again. And so we have to think a bit harder. Unfortunately, we’re not about to reveal all the sectors that will bounce back with a vengeance, because we don’t know. We do believe that more people in Myanmar will continue shopping online as they’ve been forced to experience its convenience, and we expect that this increase of demand will help buoy eCommerce in general. Other services going online may also fare better than before Covid-19, though not all. Will people buy more cars to avoid public transport? Probably those who can afford to will, but private vs public transport is a very income-driven choice in emerging markets. People are not suddenly better off. In fact, the economic impacts are going to hit the broad majority of people, just think about key affected sectors: tourism, apparel, agriculture, fisheries, F&B. That’s not part of the economy, that’s the economy. Meanwhile, investors have dry powder (i.e. money to invest) and will be supporting their existing portfolios, but also continuing to make new investments. With that acknowledged, let’s say for the sake of argument that whatever happens next there’ll be some new investments being made. Here enters the role of the Schumpeterian entrepreneur: the trail blazer who spots opportunities, takes risks and creates value which disrupts the market. Heed this: consumers and businesses are going to be looking for innovations that help them through the more challenging times ahead. Innovations are not inventions. Invention is making a light bulb, innovation is everyone using light bulbs in their homes; innovation is the commercialisation of invention. Some countries are great at invention and innovation, others less so. But, innovation can be imported from abroad (just look at China’s growth since the 90s). We’ve seen successful and unsuccessful attempts at startups using business models already popular abroad to launch products and services in Myanmar. Obviously, not all ideas that work elsewhere will work here. But many will. We’re not suggesting for a moment that starting a business from scratch and making it a success is easy just because the idea works somewhere else. We know that it isn’t. What we are saying is that there are tough times ahead and entrepreneurship is going to be a key component in prospering through them. And so, to anyone reading this who has recently started a new venture, we commend you. Entrepreneurs break boundaries because they take risks, and that takes guts. Got an idea? Innovation requires executing on ideas; “Vision without execution is hallucination”, meaning that it's putting the idea into action that’s the hardest part. We can all dream of flying cars, after all. To help guide your idea, we’ve developed a pitch deck template for you which asks you to answer certain questions. Feel free to use this next time you’re pitching. And, if you’d like our feedback, send it over and we’ll let you know what we think! [email protected]. Earlier this month, EME joined nearly 2,000 leading experts from the marketing industry at Mumbrella 360 Asia - the region’s largest marketing and media conference, held at Singapore’s Marina Bay Sands. At this conference, the industry’s biggest players come together to forge connections, ask pressing questions and share their secrets and strategies to achieving success. Speakers and panellists were invited from leading global companies such as Unilever, Johnson & Johnson and Prudential; tech giants like IBM and Netflix; media leaders such as CNBC; NBC Universal, BBC and Vice; and up-and-coming companies like Lazada, TikTok and Twitch - all of this in addition to the marketing industry’s biggest firms: Ogilvy, Kantar, Hubspot, UM and Accenture to name a few. As you can imagine, it was an action-packed two days of knowledge sharing and information overload. In this blog, we share some of the things we learnt. Promotion by Emotion Several of the keynote speakers emphasised the need for brands to strive to push out emotional content, rather than the typical barrage of rational and functional marketing messages that brands constantly churn out. Why? Because emotional content is more likely to be shared and engaged with, and it is also more likely to be remembered by the consumer brain. Since consumer behaviour is 99.9% driven by the highly emotional subconscious, there’s an emergence in neuro-marketing among companies and agencies, as well as media companies, for getting their messages across. This means marketing with behavioural economics instead of neoclassical economics - instead of using typical functional selling points like “a product is cheaper, bigger and tastes better”, there is now a shift to “a product gives you happiness, makes you feel safe and strengthens your relationships”. Coke’s “Choose Happiness” is a strikingly obvious use of emotional marketing. Trigger Happiness We learnt that while generally an average of 50% of purchases come from word of mouth, 80% of what triggers word of mouth is good brand experiences, not only functional from end to end (everything works, nothing is broken) but also meaningful (not only is nothing broken, it was so easy to use because my needs were anticipated). To take this up another gear: company’s should aim for pleasurable experiences (not only is nothing broken and the platform quite easy to use, the content was hilarious and brightened my day). Where can customers rank their experiences with your brand?
(For)give Me Another Try Building close relationships with customers is also a good hedge against future misdemeanours. Customers who have a connection with brands and companies, whether with positive brand associations or great brand experiences are not only more likely to make a purchase or tell a friend (this we knew already), but they are five times more likely to forgive a brand for mistakes made. This is crucial in the world we live in, considering such mundane things like a five-minute response delay or misspelled customer name could result in customer loss in this age of fast-paced and hyper charged customer service (the age of the pampered customer). Just (keep) do(ing) it Big brands are becoming all about predictive personalisation. That is, using data-driven content automation to enhance customer experiences and keep people coming back. In our digital age this is as easy as simply relying on users’ behavioural history with the brand’s platforms in order to determine the perfect algorithm for developing content that their users will find interesting, engage with and most importantly lead to sales or conversions. If you’re still unclear what this means - just scroll through Facebook and note that you keep seeing more cat videos ever since you spent a whole day watching cat videos. Go your own way Lastly, we learnt that we should be wary of “best practices” because it’s those disruptors who break the mold of best practices that truly find success. Startups and early stage companies especially are most likely to pattern growth strategies based on existing companies, which could be a crucial mistake[c1] . From a VC firm’s keynote we learnt the key steps for bootstrapped growth: identifying the brand’s purpose, building brand assets, identifying platforms, developing powerful stories, growing advocacy and loyal customers and of course, tracking. This is a good guiding light to follow, since doing too much in the short-term could be harmful for long-term growth if these short-term activities are not linked to long-term strategies. All in all, it was great to link up with the region’s very best marketing professionals, and we can’t wait to take back everything we’ve learnt and apply them towards the growth of EME’s fast-growing portfolio companies. Do you agree with what we’ve shared? Have anything to add? Drop us a line at [email protected]. A good financial model is a little bit like magic. You can gaze into the future and compare how decisions you make today affect what happens for years to come. Of course, even the best financial model is only a representative of what could happen. None of us can truly see into the future, try as we might. What makes a “good” financial model? A financial model is just a business tool, so a good one is one that gets the job done. It should be error-free, clear to use and provide results that are easy to interpret. Similarly, you need a different tool for different jobs; the financial modelling requirements of a listed company are going to outweigh those of a young startup.
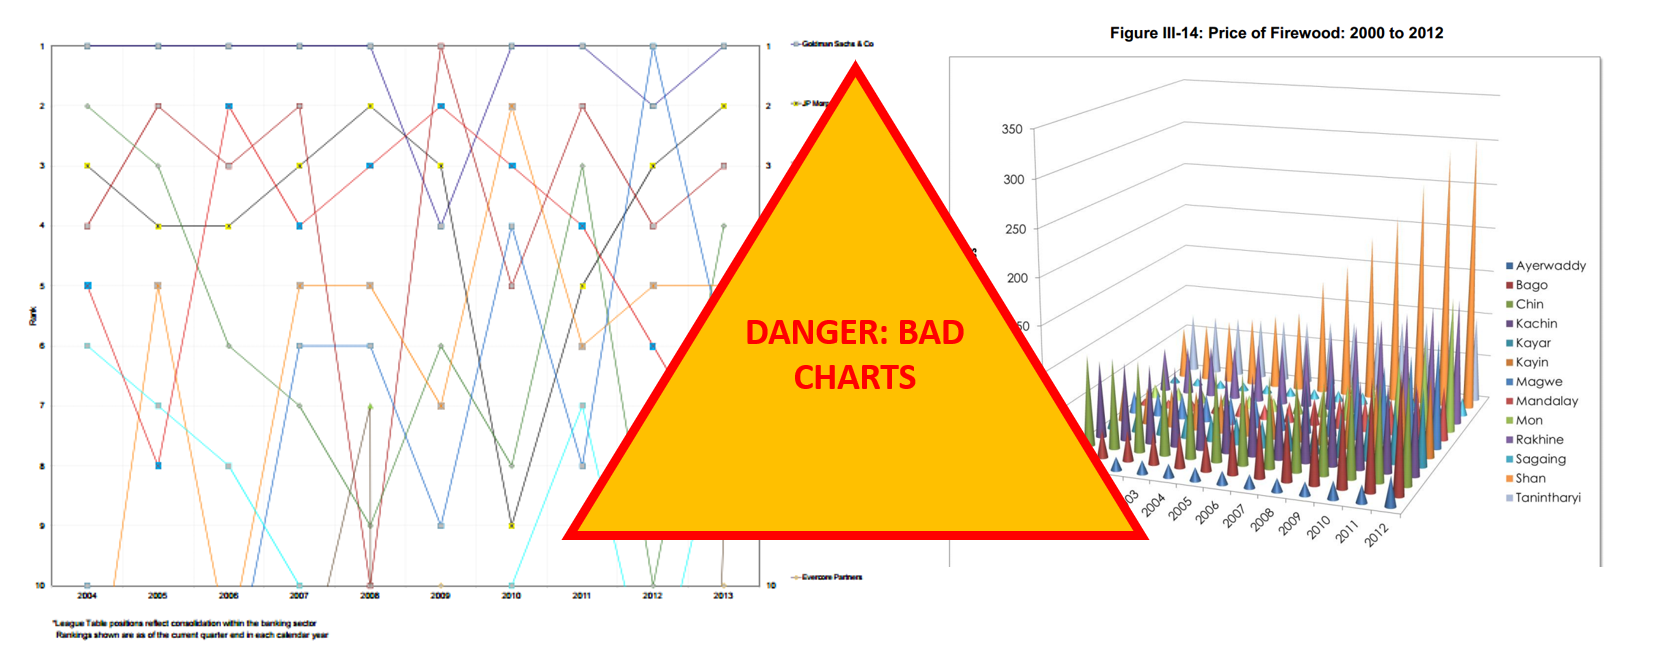
When we planned this post, we were intending to share a financial model template that we’d found online and provide some usage notes / pro tips. However, it turns out that there is a dearth of appropriate models that are ready to use by reasonably inexperienced people. The models we came across were either overcomplicated or very limited, so we decided to create our own! You can download our subscription model template at the bottom of this post, and below you’ll find some good modelling principles to help you make your own. Garbage in, garbage out The first rule when creating projections of any sort is: garbage in, garbage out (GIGO). This simply means that if you make wild or erroneous (or both) assumptions when putting information in, you can only expect to get wild or erroneous results out. If my model says I can take 10% of the total addressable market, but I get the market size wrong, my model will be wrong. This means that the initial research behind your figures is crucial. Research your inputs and check your assumptions as much as possible before entering them into any financial model. You can be sure that investors will ask, “how did you get to this number?”, so be ready to defend your projections. Top down vs bottom up Check out our recent post on top-down vs bottom-up approaches to market sizing. With financial modelling, we also want to start at the bottom and work back. For instance, if you simply estimate your sales are growing at 10% month on month, you can quickly miss the underlying details. Your sales are unlikely to grow for no reason. More likely, you have marketing and sales expenses that together help drive sales. At the very least, you need to consider in detail how your HR, marketing and related costs are going to contribute to increased sales. Rather than assume sales grow at 10% and sales staff expense grows at +1 person a year, ask how many sales one salesperson can make in a month then multiply this out to the year, then work up to sales output. KISS Keep it simple, stupid (KISS) is a design principle that is clear to understand: keep things as simple as possible, so that they’re easier to use. This goes for financial models too: separate your inputs clearly, build your model logically and add notes wherever necessary. Adding usage notes is not only good practice for any spreadsheet design, but it'll help you understand what you've done so far, in case you start to get stuck with your model. If you make a good pitch to an investor, there's every chance they're going to want to see your financial model - so it's good for it to be clean and easy to read. Use charts effectively Don’t rely on people to read hundreds of lines of your model. If your model requires complex calculations that’s fine, but these rows shouldn’t be used to present information. In our template, there are “inputs” and “outputs” plus some charts. This is to keep things straightforward (and our outputs are only 100 lines or so). Another approach is to model sales and revenues separately to costs and then to present the outputs of these sheets in a summary sheet. Whichever you do, it’s advisable to add some charts to show what’s going on in the model. If you haven’t seen it yet, check out our quick guide on what makes a good chart. Build what you need, then stop Think about building your financial model like building a ladder. You need enough information (rungs) for your purpose. You might even add a few extra rungs, to make it easier to get on and off the ladder at the top. But if you keep adding rungs, you’re going to have a very large ladder that’s cumbersome to move around and doesn’t offer much beyond the much smaller one that suits your need. Financial models can go on and on, but there comes a point where adding more variables isn’t necessarily making your model any more accurate. If the model represents key costs, how you acquire customers and how you generate income and adapts to show different outputs based on your input assumptions, it’s probably all you need to begin with. Remember, the more complex something is, the easier it is for errors to hide. It’s better to have a simple and correct model than a complex and wrong one. You can download our basic subscription financial model here. Our intention isn’t to provide a one-size-fits-all model (does such a thing exist?) but rather to guide founders on how to go about representing their business model in spreadsheets. The best financial model in the world won’t grow your business, but clearly laying out how your business makes money should help you make better decisions. Good luck! A couple of weeks ago, we wrote a blog about Metrics that Matter, which among other things warned of using cumulative revenue charts. This got us thinking about other charts and graphs that we’ve seen in pitch decks and presentations. Some have been excellent, while others have been distracting and confusing (two things you don’t want your pitch to be!). Therefore, we decided to share some thoughts and recommendations on the types of charts you should and shouldn’t use. First, a very quick introduction to data visualisation (i.e. charts, graphs, tables, etc.). We use visual aids to make it easier to show a trend or phenomenon. If you’ve made a super complex chart that takes more than a few seconds to understand, you’ve failed at data visualisation. This is a comforting thing to be aware of: if you struggle to understand a chart, it’s not you, it’s the chart’s design. Let’s add some rules to what makes a good chart: 1. Efficient- this is like “easier”, it should be easy to read and more efficient than the alternative of writing it out (i.e. a table); 2. Meaningful- pick data that means something, just as investors care more about how much revenue you’ve generated rather than the average time of bathroom breaks your employees take; 3. Unambiguous- if it’s not clear what the data is, then it probably needs a label or shouldn’t be there! Now that we have the rules mapped out, let’s look at some bad charts. What’s wrong with the chart below? For a start, try guessing what the value is for Sagaing in 2003. If that’s not hard enough, try to then compare that to the value of Mandalay in 2010. Now, quickly glance and say which is higher overall, Shan or Kayin. All in all, this graph is impossible to read because the 3D design hides things, colours of series are the same (or very similar) and there’s just too many datapoints. This chart fails all three rules. Let’s take a look at the chart below for another example of bad charts. We’ll let you decide why this one is bad (if you need a hint, just time yourself while you try to work out what’s going on). Not all charts will be so terrible that you recognise them as “bad charts” from the beginning. While it’s pretty easy to avoid making charts that look like those above, there’s a long way between not making those and making good charts. We try to keep our blogs to around 500-600 words, so in the next 150, we’ll set some rules to make life even easier when representing data. A) Don’t use pie charts Simplest rule is don’t use them. If you must, don’t include more than 4 segments. Never compare a pie chart to another pie chart and never, ever, use 3D pie charts. If you’re not sure, revert to the title of this rule. B) Order your data Annual data should typically be presented chronologically, but other data should be presented in a structured way: smaller numbers running to larger numbers, or vice versa – this makes patterns much easier to spot. C) Forget grid lines, use data labels (and bigger fonts) Remember, the idea is to make it easier to read a chart than a table. Looking for the biggest column / bar then checking the axis value and running your eyes along to see the column / bar value is a lot of looking around; instead, use well placed, easy to read data labels. If you want to learn more about good and bad charts, you’re in luck. There are two wonderful resources on the subject we would highly recommend:
We helped Bagan Innovation Technology estimate the Myanmar market size for fortune telling and now we’re sharing how we did that.
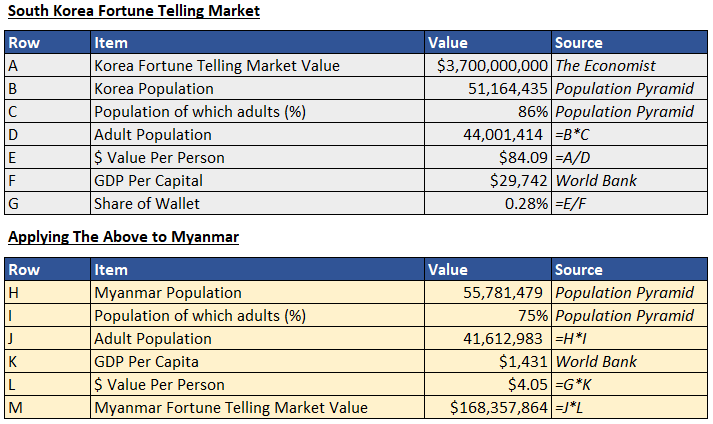
It’s a common sight at startup pitch events all over the world (including here in Myanmar): a founder talks about their product and traction and then claims the market size for their product is hundreds of millions (or billions, especially in larger markets). If the entrepreneur can access just a tiny percent of the total market, they can achieve revenues of $2-3m in the next two years, even though revenues today are non-existent. We can’t blame entrepreneurs for this: with a few minutes to impress, they need to use big numbers and we’re always telling entrepreneurs to think big. But things can often fall apart when the entrepreneur is questioned about their assumptions behind the market figures. Market sizing is the process of estimating the total dollar potential of a market. Simply put, how much money is spent in total in your target market? Example: we estimate that the total amount of money spent on fortune telling services in Myanmar is around $200m. You’ve probably heard about TAM, SAM and maybe SOM. These are Total Addressable Market (TAM), Serviceable Addressable Market (SAM) and Serviceable Obtainable Market (SOM). There’s plenty of definitions for these elsewhere so we’ll skip over them today, just know we’re talking about how to estimate the Total Addressable Market, which is total annual revenues in a market – this is the first number you’ll need before estimating anything else. Top down or Bottom Up There are two approaches to estimating market size: top down and bottom up. Top down approaches start with a big number and – you guessed it – work down. If we know the total amount people spend on grocery shopping, we can make some assumptions about how much people spend on particular products (i.e. 5% of their shopping basket is onions, so the market size for onions is 5% of the grocery shopping market). However, in Myanmar good data points can be hard to come by. What we often do, therefore, is look for a comparison country and work back. In our example, we saw that The Economist (a reputable newspaper) claimed the market for fortune telling in South Korea will soon be $3.7bn. Top Down Now, Korea has a similar size population to Myanmar, but incomes are much higher. Therefore, we want to find a way to apply the Korea results to Myanmar. Here’s how we did it: we worked out how much % of their income Koreans adults spent on fortune telling and applied this to Myanmar adults. The result was that people spend around 0.28% of their annual income on fortune telling. In Myanmar, that’s a $168m market.
Bottom Up
Bottom up approaches start from the smallest number and work up. If we’re talking about onions, we’d find the price of one onion, then estimate how many onions people bought on average each time they shopped, how many times a year they shop, etc. until we got to the total market value for onions. For fortune telling, we did the same: take the average price for fortune telling in Myanmar, how many times would people go to a fortune teller in a year, and how much of the population uses a fortune teller. This approach gives us a total market of $222m.
Which approach to use?
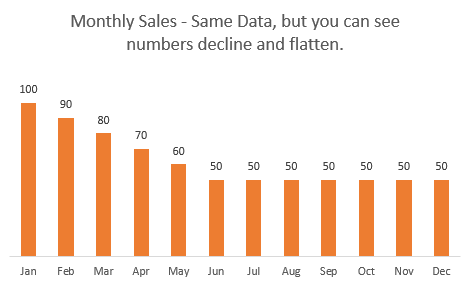
The simple answer is both. But we like bottom up approaches as it shows you’ve thought about the actual occurrences required to build the market size (rather than abstract numbers without much real-life meaning). Taking the time to go through both approaches helps you triangulate your results. In the top down approach, the only assumption we make is that people in Myanmar spend the same share of wallet on fortune telling as people in Korea, but this is a huge and hard to test assumption. In fact, when we do our bottom up approach, we estimate people spend on average around 10,000 MMK ($6.6) which is closer to 0.5% of income (this highlights the abstract nature of top-down approaches). Also in bottom up, we assume 40% of the population uses fortune telling services - this feels right to us based on our market knowledge and is a number we’d happily defend. In our case, as the discrepancy between the top down and bottom up approaches was rather small, we decided to take the average: $194m (hence the “around $200m” at the start of this post). Taking the average lets us not be too bullish and allows us to better defend our estimations. However, as you can see the bottom up approach just makes a lot more sense and is easier to understand. In all likelihood, the fortune telling market in Myanmar is more than $200m. Note: $194m is a huge, huge market for Myanmar. Fortune telling is a fundamental part of culture and something people are already consuming. We would not recommend trying to come up with a number, but instead following these processes to get to a result. Don’t worry, we’ve invested in markets as small as $20m. Yes, large markets are good, but it all depends how much of the market you can take and how fast the market is growing. Our advice is to be honest with yourself (and others) about market size and use this to guide your market strategy. Stuck on market-sizing? Get in touch with us at [email protected] and let us know where you’re up to. We’d be happy to share some ideas! We’ve met more than 150 startups in Yangon and Mandalay and we continue to meet more every week as we seek the most promising early-stage companies in Myanmar. Over the course of these meetings, we’ve seen and heard some excellent pitches as well as some more confusing ones. We’ve noticed on a few occasions some confusion over certain terms when it comes to startup company metrics. Therefore, we thought it would be useful to clear up some terminology on business and finance metrics for startups. This isn’t a list of the only metrics you should be measuring. It is a list of things we know people get wrong sometimes. It’s also a list of the metrics that we like to see at first glance. These metrics tell us about the company and market potential and provide enough information to get us interested to learn more (assuming the numbers are good!). If anything remains unclear after reading, or prompts a question, contact us at [email protected]. Revenue or Bookings? Revenue is recognised once a service or product has been provided. Bookings is the value of the contract between the company and the customer. Let’s say you subscribe to receive a monthly milkshake for $5/month, you sign a twelve-month subscription for $60. The $60 represents the bookings for the milkshake seller. The milkshake sellers will then recognise revenues of $5 each month until the end of the contract. Now, if you bought twelve milkshakes at once and took them home, then the seller would have provided the goods and therefore would recognise the $60 revenue. Getting these things mixed up can appear misleading so ensure you’re clear with investors. Bookings = contract value. Revenue = money for the service or product that has been provided. Gross Merchandise Value or Revenue? Gross Merchandise Value (GMV) is the total value of the transactions going across a marketplace. Revenue in this case is the amount that the company takes from a transaction - the commission, either flat-rate or percentage. If I have a marketplace for bringing together buyers and sellers of shoes, and 100 pairs of shoes are sold at $25 each then the GMV is $2,500 (sales price x number of sales). If in the next month the 200 pairs of shoes are sold at $25, clearly the GMV is $5,000. GMV therefore shows the activity of the marketplace and helps investors understand the market size. If the company charges 10% on transactions, then revenue would be $250 and then $500 on the above examples. GMV is not revenue, it’s about the market not the money your company is making. Revenue is the amount your company makes by providing a service - in this example the service is bringing together a buyer and seller and facilitating a transaction. Monthly Figures or Cumulative Figures? If you sell three items in month one, two in month two and one item in month three, your sales are clearly declining, but if you show a cumulative chart - it’ll still show an increase, from 3 to 5 and then 6. Investors do not like cumulative charts because they are misleading. We want to see your monthly users / sales increasing and at what rate. Therefore, while it may be tempting to use cumulative charts, don’t. Show your monthly activity and your month on month (MoM) growth. If your product is right and you’re reaching your customers, your users / sales should be increasing every month. If they aren’t you need to question why; and then make changes that drive growth. Once you have some solid month on month growth, then you have an interesting chart to show investors. Downloads or Active Users?
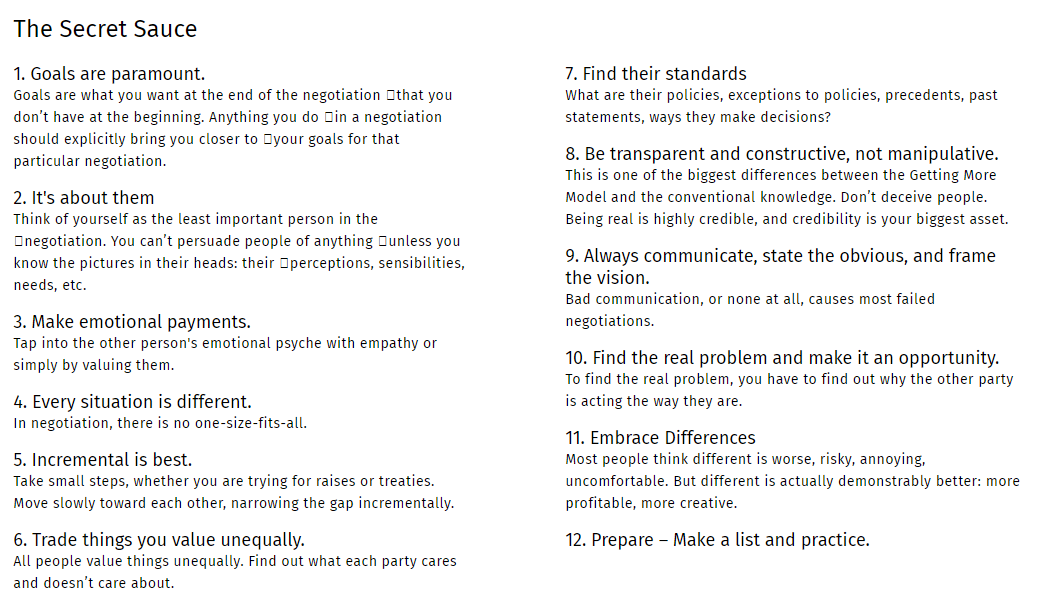
Downloads is the number of people who have downloaded your app, while active users is those users that are still using it. Active users would tend to be quarterly, monthly, weekly or daily - it depends on what your app / service is. Pick one that works and use it. You might have 500,000 downloads, but active users is where the value lies as these are the people actually engaging with your product. We would recommend breaking your active users into groups (i.e. paying, not paying) to help show if your business is managing to increase users who are paying for your services. Also consider if your active users are carrying out behaviours which you want to tell potential investors - such as recommending new users, providing positive feedback or enquiring for additional services. Operating Expense or Costs of Goods Sold? Costs of Goods Sold (COGS) relates to the costs required to produce a product. Operating Expenses are expenses that are not directly related to producing a product. Let’s say I sell a banana milkshake for $5; I paid a total of $2 for the milk, ice cream and bananas so my COGS were $2 (or 40%). The milkshake was made by my staff member who receives a salary, in my cafe where I pay rent using electricity which I pay a utility bill for; each of these items is an operating expense. With a software-as-a-service (SaaS) business, COGS tend to refer to the costs involved with providing the software: hosting fees, third-party products involved in delivery, and employee costs for keeping things running. It’s worth being clear what you’re including in SaaS COGS as some investors may have slightly different interpretations. Why is it important to define COGS properly? Because revenue minus COGS is equal to gross margin; and dividing gross margin by sales revenue gives you gross margin percent which tells you (and investors) how much the company retains from every dollar (or Kyat) sold. Update 9th July 2019: Comment from Sam Glatman, Founder of "Zingo" a startup in Myanmar providing oral care products for betel nut chewers: The metrics that matter article is great and raises an issue that we have been working on internally recently. In our case, we have been differentiating between “sell in” and “sell out”. “Sell in” is a sale on credit to a distributor. “Sell out” is a sale either by us directly or by a distributor to a betel vendor who pays hard cash. We realised that while “sell in” is where our top line revenues come from, the only relevant metric for us is “sell out” because it’s leads to hard cash, and demonstrates real consumer demand. For us (and many start ups), cashflow is a far more relevant success (& survival) metric than P&L, and top line revenues are not as indicative of cashflow as might be expected. Pay Rises and Hostage Situations When did you last negotiate? Probably, it was sooner that you realise. Negotiation isn’t all pay rises and hostage situations, it’s the process of agreeing on an outcome. If you want to leave work early today, you might offer to stay an hour later tomorrow. If you picked what to eat last night, perhaps you told your friend / partner that they could pick next time or explained that you knew the best place to go. These are negotiations in our daily lives. We negotiate every day to some degree, but if we don’t even realise we’re doing it, how do we know if we’re getting enough in the agreement? In his book, Getting More, Stuart Diamond teaches how with some simple core principles it’s possible to become more effective negotiators, both at work and in our day-to-day lives. Diamond is an American Pulitzer Prize-winning journalist, professor, attorney, entrepreneur, and author who has taught negotiation for more than 20 years. But, he claims, the lessons in his book can be implemented by anyone. Sounds too good to be true? I gave Diamond’s lessons a try and got a big discount at a local gym - not life-changing, but many little discounts add up. On a more relevant topic, investors and founders will hold hundreds of negotiations between one another. Of course, valuation is often a negotiation, but think about term sheets, CEO salary, budgets, future capital raises or even small things like requesting support, asking for introductions or agreeing on where your board meeting will be held. Diamond is clear in his book: if both parties understand negotiation, both can come out with more. Diamond's 12 Strategies Don't be Hard, be Smart
How can both parties get more? It depends how you define “more”. One thing Diamond teaches is being very clear about what you and the other party want. First, ask three questions: What are my goals? Who are “they”? What will it take to persuade them? Next, ask yourself these same questions for the other person (or persons). Then, try to trade things of unequal value. I wanted to go to the gym in the morning, not the evening; mornings are not busy at the gym so I asked if I could have an off-peak discount. I traded “peak hours” which had zero value to me, while the gym could still improve their income by selling a product of lesser value to them “off-peak hours”. All that was necessary was understanding what each party wanted. I didn’t want “gym membership” but rather “access to the gym early in the morning.”. If you’re raising capital, do you want “$100,000” or “funds to help you scale”? Does the investor want “as much equity as possible” or “equity enough to balance their risk”? If it’s about balancing risk, how else could you reassure the investor? The key is once you have a clear picture in your head of what you want, you need to get that picture into the head of the other person. To do this, Diamond recommends role playing the negotiation - taking the role of the other person. Think about what they want, how they would respond and have a friend help you go through the motions. If you can understand the picture in the other person’s head, you’ll have more chance of discovering how to show them the picture in yours. Borrow the Book from EME There’s a lot more to discover in Diamond’s book - if you’re interested, we have a copy at EME we’d gladly lend to you. Diamond can be a bit self-congratulatory, but it's worth persevering through at least the first half of the book. Before we finish, let me leave you with some key points that echo throughout his book:
We hear hundreds of pitches a year and we’ve realized there are only two elements you really need: a story, and numbers.
People love stories. They provide meaning to an otherwise disordered and chaotic world. As celebrated author Yuval Harari argues in Sapiens, human civilization developed due to the creation of ‘shared myths’ - stories that allowed large group of humans to cooperate under the banner of a common tribe, religion or civilization. As investors, we’re looking to see if you can tell us a compelling vision for how you want the world to be. If you can convince us, then you can likely convince your future customers and employees about your idea too. Steve Jobs reputedly had such an ability to persuade people that colleagues described it as a ‘reality distortion field’. It’s no coincidence therefore that Magic Leap, a company making next generation augmented-reality hardware, managed to raise billions of dollars before ever releasing a product or making a cent. On the other hand, numbers are super important too. Nobody is going to argue with 10-20% month-on-month growth, and we guarantee that all investors will salivate over a hockeystick- shaped revenue chart, particularly if it stretches back more than 6-12 months. Numbers (particularly revenue, transactions and active users, although the important metric will vary somewhat by industry) prove that you have convinced some people, somewhere out there, to spend some time or money on your product. This means that you are creating value and it’s a necessary condition for a successful idea. Buffer is a good example of a simple idea (social media scheduled posting) with great traction and execution. In this case, the founders managed to tell a compelling story based around how quickly they were growing. Ideally, your numbers and your story back each other up. A word of caution however - don’t try to fake the numbers, and don’t pump up growth artificially by spending huge amounts on marketing. It doesn’t take much business savvy to sell a $10 product for $1, although your numbers will look great for a little while. While these growth-at-all-cost strategies may work for the big American and Chinese startup ecosystems (think of the huge amounts spent on ride hailing and food delivery promotions), they take a huge amount of investor capital and have a very high failure rate. In emerging markets, investors are generally more cautious and want evidence that you are actually creating sustainable value for your users. Check out this excellent gallery from Airtable contains historical examples of pitch decks from successful companies. We particularly liked WeWork, Buzzfeed and Youtube. In these pitch decks, you can just smell the potential sizzling. There’s an energy to them, generated by the combination of compelling stories and early growth that foreshadows their successes to come. All standard pitch deck templates contain a similar set of elements: Problem, Solution, Market, Traction, Team etc. We think these are important, and you should definitely have these elements (check here for our favourite guide ). But more than that, spend time on coming up with a good story. Then generate the numbers to back it up. That’s all there is to it, really. Evaluating early-stage startups as an investor is hard. Giving constructive feedback is even harder, at least if you want to say more than ‘Cool idea’ or ‘You need more traction’. That’s why at EME we use a tool called the VIRAL Scorecard, originally developed by the folks at Village Capital, to be more rigorous in our conversations with startups. Before we dive into how it works, it’s worth emphasizing that this is a discussion tool, not an objective, quantitative measurement of a company’s worth. Data scientists out there may wish it was possible to measure a couple of key indicators, feed them into a model and predict which companies will succeed, but that’s not how early-stage companies work. JFDI, an early-stage VC in Southeast Asia tried to do just that with their Frog Score index, but abandoned it after finding zero correlation between how highly a company scored on their index and how well the company did later on. Instead, the VIRAL Scorecard tries to create a framework for a structured discussion about each aspect of a business. The VIRAL Scorecard describes a number of dimensions of a business including Team, Product, Market etc. Each dimension has 10 stages, with criteria for each stage. Let’s take a look at the first couple of stages in the Product dimension: The scores are cumulative, so if you meet the criteria for stage 4, you should also meet all the previous criteria. It’s important to note that the criteria are somewhat subjective - what is the difference between ‘low-fidelity prototype’, ‘working prototype’ and ‘fully functional prototype’ for example? Here’s how we use the tool when we talk to a startup:
In the meeting, we go through each component of the VIRAL Scorecard, first asking the startup to share their score and reasoning. Then we’ll share our score, and ask follow-up questions. If the scores are similar, great, we’re on the same page. If the scores are very different, that tells us one of two things: EME and the startup has access to different information: As investors, we will know less about the business than the founders, and our scores will reflect that. At an early stage, we probably won’t have seen detailed financial projections or customer feedback. Conversely, sometimes we will know more about an industry and what the competition is doing than the startup. If this is the case, we’ll have a discussion and often revise our scores. EME and the startup have different understandings of the fundamentals of the business: Sometimes startups will try to score themselves as high as possible, in the hope that this will make the company seem more attractive. It’s a reasonable approach when faced with a scorecard, but often has the reverse effect. We want to companies to be aware of their limitations and current state. We’re less interested in the final score and more in constructive dialogue. In this meeting, we’re really trying to get a sense of how the founders think, and how we could work together. It’s a cliche that venture capital investors invest in people rather than companies, but that’s particularly true for early stage startups, which could be several pivots away from their eventual model. This conversation is potentially the beginning of a long-term relationship between the investor and the start-up, and like all relationships, good communication and shared values are essential. These conversations are good for digging deeper into the fundamentals of the business, and often reveal things that we hadn’t even thought of asking about. The VIRAL Scorecard is also helpful in providing concrete points for feedback. Instead of saying things like “You’re too early-stage”, we can say “We’re still unsure about your business model, and we’d like to see some more work done on your unit economics”. We invariably learn a lot from these conversations, and we think they are useful for startups too. At the end of the day, the final score doesn’t really matter - what matters is the quality of the discussion, and the shared understanding that has been created. Fast-growing startups have a lot to think about, survival being top of the list. Yet in the long term, the way a startup manages people is absolutely crucial for success. As Peter Drucker said, “Culture eats strategy for breakfast”. Creating a productive and healthy work environment where employees are empowered is the difference between an average and a great company. From the traditional ‘Human Resources’ to the trendy ‘People Operations’, there have been many approaches to the art of managing people. Yet they all encompass the same basic elements, summarized as follows:
Startups change quickly, and HR is often slow to adapt. A rule of thumb is that for every tripling in headcount, the internal systems of a company need to change. A one-person startup is very different from a three-person startup, and a ten-person startup is yet again different. The goal is to have a balance between structure and flexibility - too many documents, forms and policies and everyone gets bogged down in bureaucracy - too few, and nobody knows what is going on. With all that said, here are some beginner steps to get you started on your HR journey:
We’ve also curated a list of resources that EME has used internally to learn about HR. Note that some of the policies and regulations mentioned in the resources may only apply to specific countries; it’s always worth studying employment law in the country you operate in. From HR to People Ops: When and Why To Start a People Team
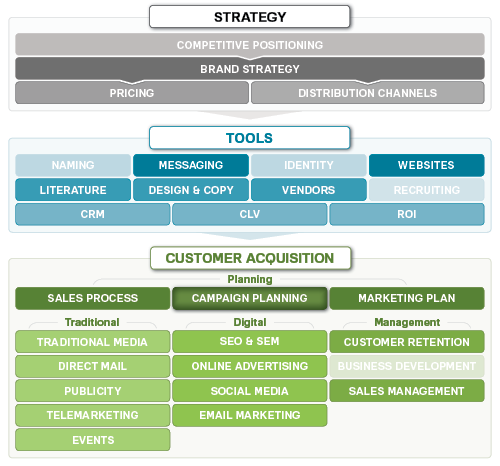
This is the first in a series of startup guides that EME will be publishing on key business skills for startups. Marketing - the process of making the customer journey clear and accessible - is perhaps the most important challenge an early-stage company needs to solve. As legendary management theorist Peter Drucker said, Because the purpose of business is to create a customer, the business enterprise has two— and only two— basic functions: marketing and innovation. Marketing and innovation produce results; all the rest are costs. Marketing is the distinguishing, unique function of the business. We have seen many startups focusing more on product than customers, and expecting the business to grow itself. While this might work in some close-knit or cutting-edge industries, most startups need to develop and master this skill if they want to scale. This is particularly true in Myanmar, where large parts of the population are coming online for the first time. Successful marketing isn’t just about spending money to boost Facebook posts. It’s about defining and executing a comprehensive plan to engage customers across different platforms over time. The chart from Marketing MO below shows just how many business areas are related to marketing, from pricing strategy to design, social media, CRM systems and sales management. Companies that execute a successful marketing strategy can become global stars, almost overnight. For example, ONE Championship, an Asian sports media company founded in 2011, has become one of the biggest destinations for mixed martial arts (MMA) fans worldwide. By combining savvy social media use with high-quality live events and exclusive relationships with local stars, ONE Championship has quickly built a loyal fan base and enduring reputation - read this Forbes article for more of their story.
While all this may seem like a lot to tackle, here are a few key steps to get started on your marketing journey:
We’ve also curated the following set of resources that the EME team has personally used to learn about marketing. As with anything worthwhile, some of these resources require significant time and energy. Also note that some of the content is not free, although we will provide access for EME’s portfolio companies. Books are available from the EME Library - please ask for more. Introduction to Digital Marketing
Strategic Marketing for the SME
Digital Marketing for Dummies
Facebook Ads & Facebook Marketing MASTERY 2019
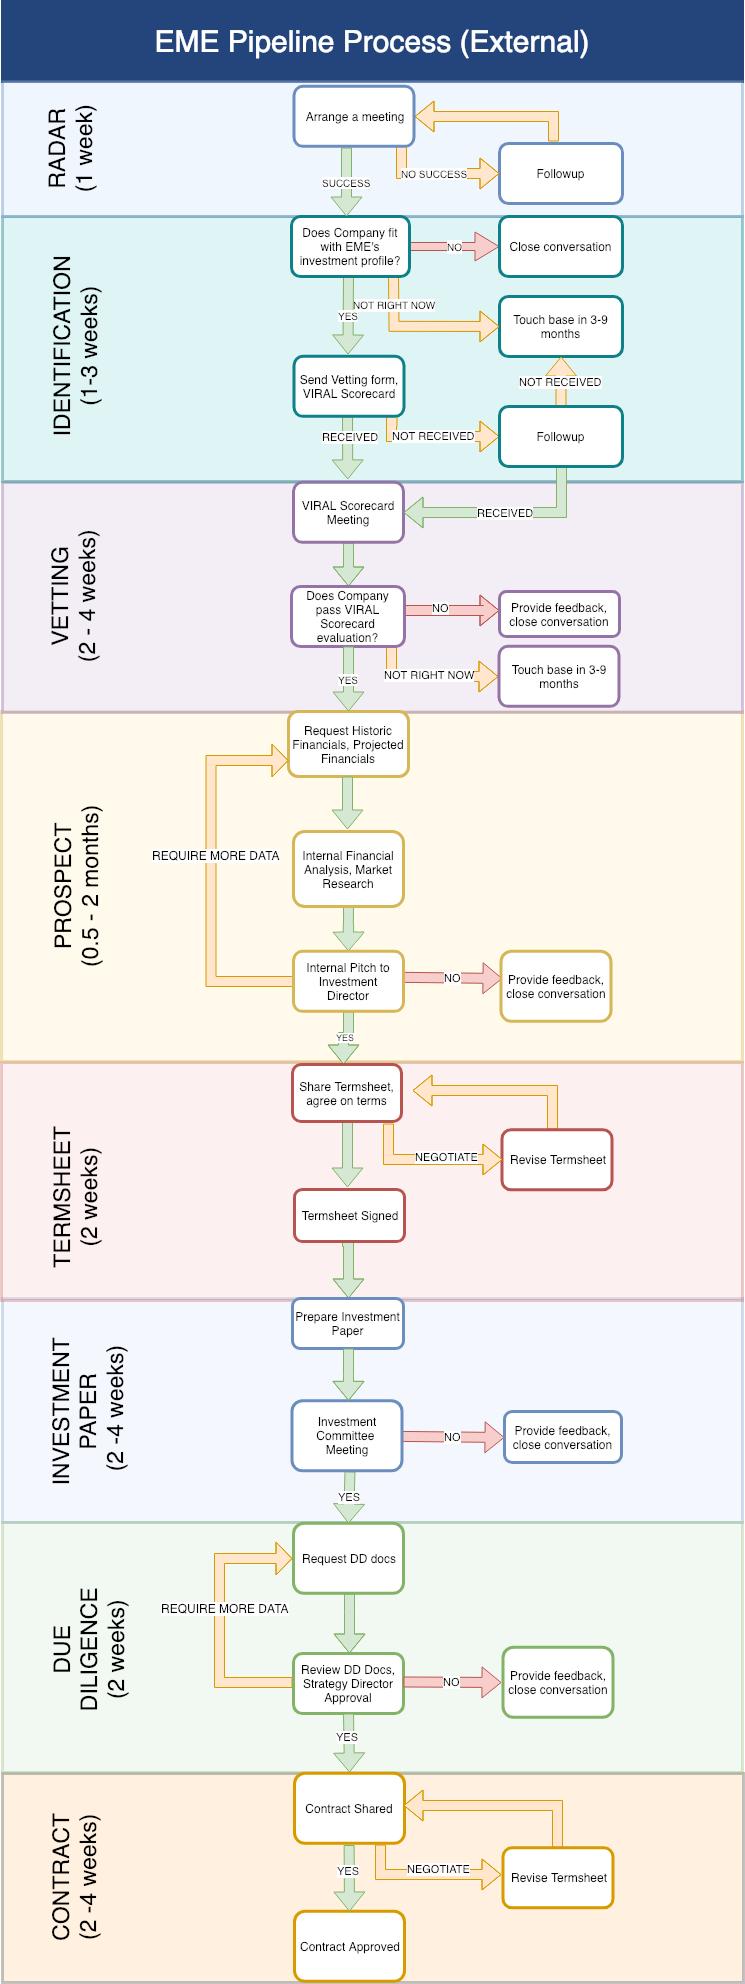
Fundraising for an early-stage startup is hard. Entrepreneurs spend lots of time crafting their message, making decks, networking, pitching and responding to requests for further information, all the while building a product and growing a team. And after several months of hard work, entrepreneurs may end up with nothing for all that effort. On the other side, investing in early-stage startups is also hard. Investors meet hundreds of startups per year, and only a small fraction of them will be alive in 5 years. There is little data and lots of uncertainty, and because VCs have investors too, they look for ways to minimize risk and maximize reward. This combination of incentives often leads to a dysfunctional system, where startups and investors both play shotgun, entering into as many conversations as possible in the hopes that one may succeed. Investors may string startups along for many months without making clear decisions, while startups may start fundraising before they are prepared and ready. The main divide to bridge therefore becomes one of communication and expectations. In this light, we have decided to publish our refreshed pipeline process, which aims to be as transparent and productive as possible. By highlighting all the stages and requirements, as well as the decision points, we hope to contribute some clarity on VC investment (or at least, our approach to VC investment). As can be seen from the chart, the process is reasonably complex - the minimum time for an investment is 3 months, although realistically it can take up to 6 or 8 months. There are also five major decision points, with increasing levels of certainty in later stages of the process. Note that this investment process isn’t for everyone - startups select investors just as much as investors select startups, and if some are put off by the complexity, that’s a good indication that a future relationship wouldn’t have worked out. That said, at all times we take our role in the startup ecosystem seriously and will always coach good startups through the process and provide feedback if and when we stop the process.
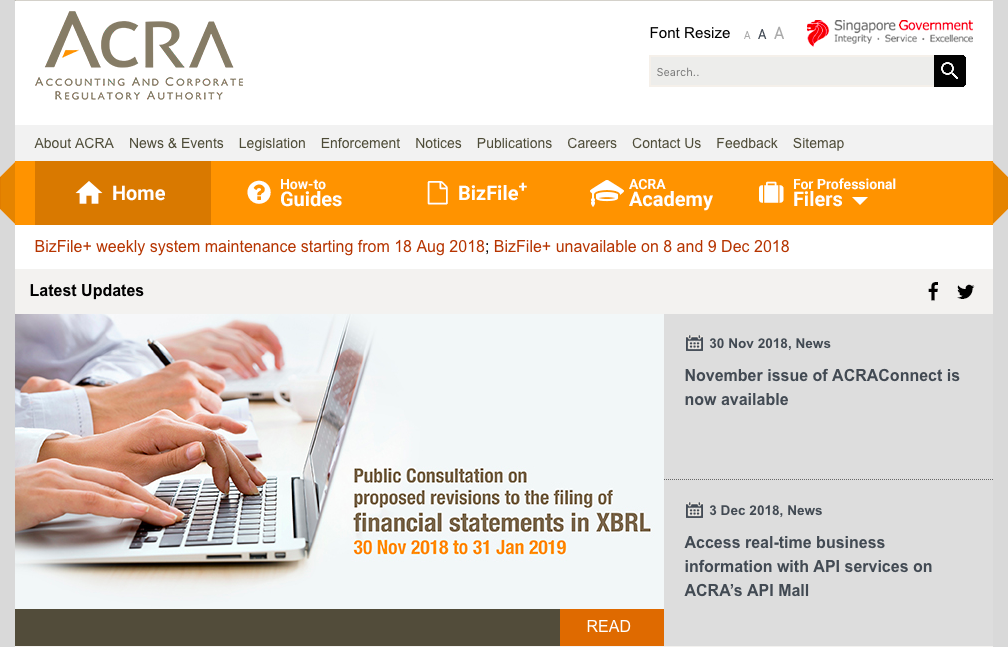
Taking on institutional capital is a big commitment, but we hope our pipeline process is a positive first engagement, and a taste of the value we can bring to our portfolio companies. We are thorough in our selection just as we’re thorough in the support and mentorship we provide our portfolio. Receiving investment from EME is not the end of a process, but the start of a journey of support, guidance and collaboration that is 100% directed at scaling great startups. Having a Singapore-registered holding company is fast becoming an industry standard among Myanmar and other Southeast Asian startups. At EME for example, we invest from our Singapore holding company into startups’ Singapore registered holding companies because Singapore offers efficient processes for company incorporation, share transfer, as well as tax benefits. However, being registered under the Singapore Company Act comes with certain ongoing responsibilities, namely the filing of the Annual Return on a yearly basis after incorporation. The Annual Return is the electronic filing process to submit required information to Singapore’s Accounting and Corporate Regulatory Authority (ACRA). It includes:
Annual General Meeting An AGM must be held once every calendar year. The deadline for an AGM is 15 months from the date of the last AGM. If the company is newly incorporated, it is allowed to hold an AGM within 18 months from the date of the incorporation. Necessary topics for discussion at the Annual General Meeting include:
Up-to-Date Financial Statements At the AGM, financial statements not older than 6 months have to be handed to the Board of Directors. The Financial statement must consist of the following documents:
The company needs to file the Annual Return within one month of holding the AGM. For Annual Filing, the company will usually need to file the financial statements in XBRL (Extensible Business Reporting Language) format, via Bizfile (ACRA's online business reporting system). Since the Myanmar subsidiary company is most likely to be owned 99% by the Singapore holding company (now it can be 100% because the new 2018 Myanmar Companies Law does not require foreign companies in Myanmar to have a local director), the financial reports must be consolidated i.e the Financial Reports of both the Singapore and Myanmar entities. This annual filing process can seem like a daunting process for entrepreneurs. As part of EME's incubation services, we help our portfolio companies to meet the compliances of both Singapore and Myanmar Company Acts. Maintaining regulatory compliance and gtting the books right is a must-do for startups with ambitions to scale. |
Categories
All
Archives
September 2020
|













 RSS Feed
